Customer Segmentation via RFM Analysis
In e-commerce, not all customers are equal. Some buy frequently and spend a lot; others haven’t returned in a year. Without data-based segmentation, marketing campaigns reach everyone with the same message — expensive and inefficient.
In this project, I performed a systematic RFM analysis on real transaction data from a UK-based online retailer (UCI Machine Learning Repository dataset) to identify high-value customer groups and derive actionable recommendations.
The data contains ~400,000 retail transactions and enabled a comprehensive, scalable segmentation.
Methodology: What is RFM?
RFM stands for three core metrics that predict customer value:
- Recency (R): How recently did the customer last buy? A customer who bought yesterday is more valuable than one who bought a year ago.
- Frequency (F): How often does the customer buy? Regular repeat buyers signal loyalty.
- Monetary (M): How much total revenue has the customer generated? This measures economic contribution.
Each customer gets a score on all three dimensions, and the combination creates segment profiles.
Data Preparation and Cleaning
The raw data required extensive cleaning, as is typical for real retail datasets:
# Excerpt from the cleaning process
df = df.dropna(subset=['CustomerID'])
df = df[df['Quantity'] > 0]
df = df[df['UnitPrice'] > 0]
df['TotalPrice'] = df['Quantity'] * df['UnitPrice']
This alone removed about 25% of the raw data — mostly returns (negative quantities), test orders, and records without customer IDs. Robust data preparation is the foundation of reliable analysis.
The Calculated Segments
Based on their RFM scores, customers were classified into 7 strategic segments:
| Segment | Customers | Share | Revenue |
|---|---|---|---|
| Champions | 630 | 12.2% | £3.2M |
| Loyal Customers | 527 | 10.2% | £1.4M |
| Potential Loyalists | 1,173 | 22.7% | £0.9M |
| At-Risk Customers | 553 | 10.7% | £0.8M |
| Promising | 485 | 9.4% | £0.2M |
| Inactive | 1,141 | 22.1% | £0.2M |
| Need Attention | 658 | 12.7% | £0.2M |
def assign_segment(row):
    r, f, m = row['R_Score'], row['F_Score'], row['M_Score']

    if r >= 4 and f >= 4 and m >= 4:
        return 'Champions'
    elif r >= 3 and f >= 3 and m >= 3:
        return 'Loyal Customers'
    elif r >= 4 and f <= 2:
        return 'Promising'
    elif r <= 2 and f >= 3:
        return 'At Risk'
    elif r <= 2 and f <= 2 and m <= 2:
        return 'Inactive'
    elif f >= 3 and m >= 3 and r <= 3:
        return 'Need Attention'
    else:
        return 'Potential Loyalists'
The Visualizations
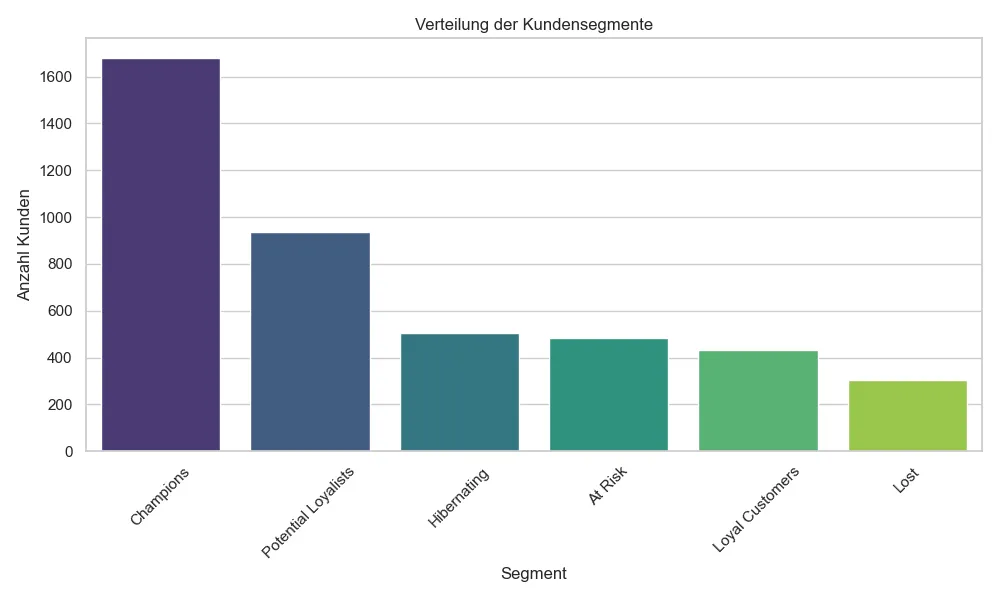 Customer distribution: the largest segments are “Potential Loyalists” and “Inactive”.
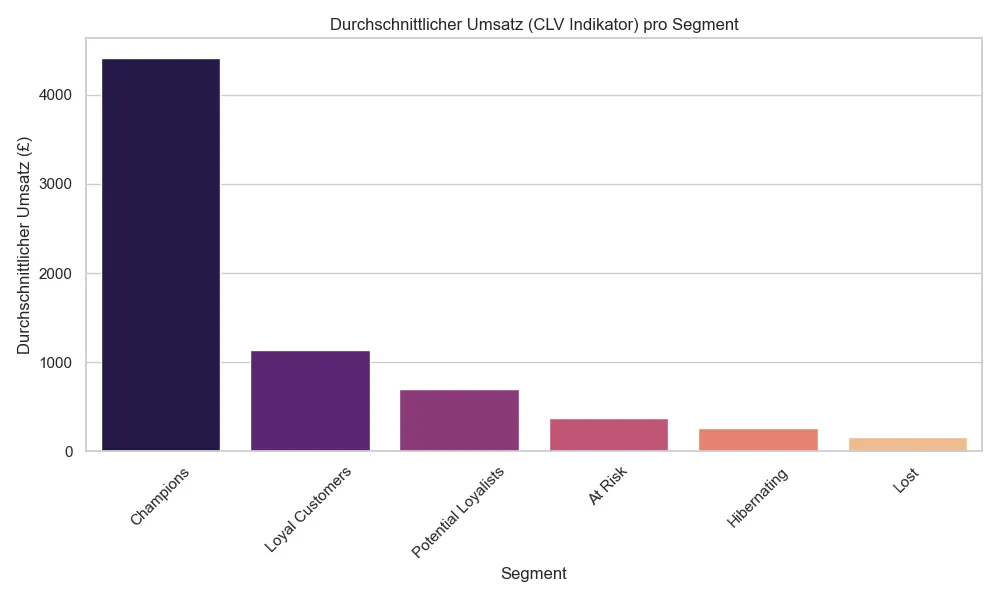 Monetary value by segment: Champions generate the most revenue despite their small share.
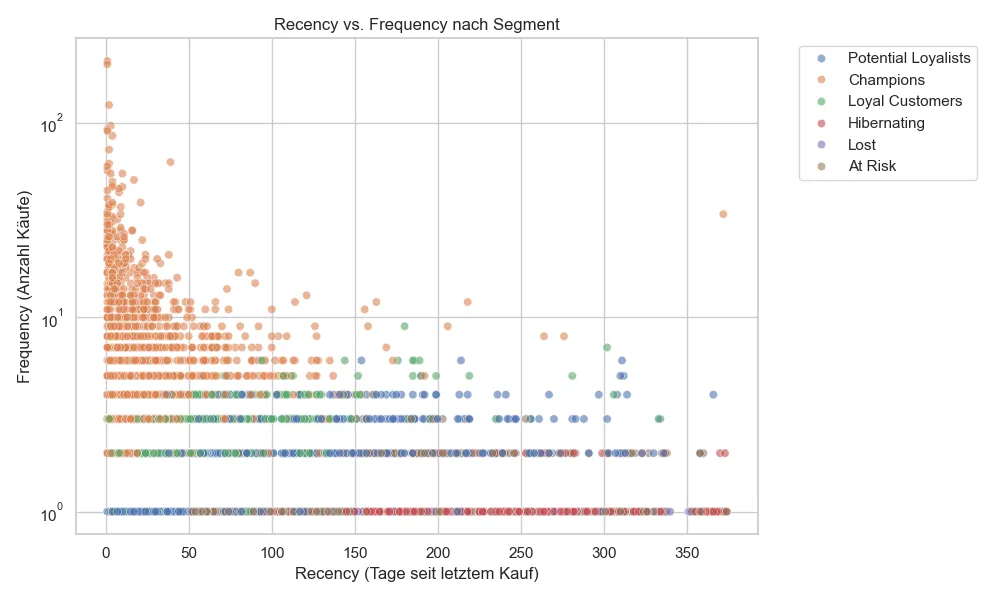 Recency vs. Frequency: the Pareto principle becomes visible — a small group of customers dominates revenue.
Key Insights and the “Lost Whales”
The analysis revealed a striking Pareto distribution: the top 12% (“Champions”) generated 47% of total revenue (£3.2M of £6.8M).
Particularly concerning was the At-Risk segment: 553 customers who were once high-value buyers but have not purchased in over 180 days. Targeted win-back campaigns for this group could recover significant revenue.
A striking outlier was Customer ID 12346: this individual generated £77,000 in a single transaction but has never bought again. A “Lost Whale” — probably a one-time large order from a business customer that was never converted into a regular relationship.
Actionable Recommendations
| Segment | Strategy |
|---|---|
| Champions | VIP program, early access to new products, referral program |
| At-Risk | Personal win-back campaign, 20% discount, “We miss you” email |
| Potential Loyalists | Cross-selling, loyalty points, bundle offers |
| Inactive | Cost-efficient email with strong incentive, otherwise archive |
Technologies Used
- Language: Python 3
- Data Analysis: Pandas, NumPy
- Visualizations: Matplotlib, Seaborn
- Environment: Jupyter Notebook
- Data Source: UCI ML Repository (Online Retail Dataset)
➡️ This analysis laid the foundation for the A/B Testing & Personalization Engine — the next logical step to operationalize the insights gained here.